Few days ago, I had to quickly create 2 plots to ask some questions in a PhD quiz. This is the code.
Required
Load required packages (tidyverse and cowplot):
library(tidyverse)
library(cowplot)
Data
Make some random data:
# 5 vectors that will be 4 groups:
raw <- data.frame(
  ctrl = rnorm(15,mean=2,sd=.7),
  mela = rnorm(15,mean=2.8,sd=.7),
  melb = rnorm(15,mean=3.2,sd=.7),
  melc = rnorm(15,mean=3.4,sd=.7),
  Group = c('treatment')
  )
Gather columns into rows:
df <- raw %>%
  gather(Group,Proliferation,1:4)
Reorder groups by ascendent concentration of melatonin, and label:
df$Group <- factor(
  df$Group,
  levels=c('ctrl','mela','melb','melc'),
  labels=c('Control','Mel 0.1nM','Mel 1nM','Mel 10nM')
  )
str(df)
## 'data.frame': 60 obs. of 2 variables:
## $ Group : Factor w/ 4 levels "Control","Mel 0.1nM",..: 1 1 1 1 1 1 1 1 1 1 ...
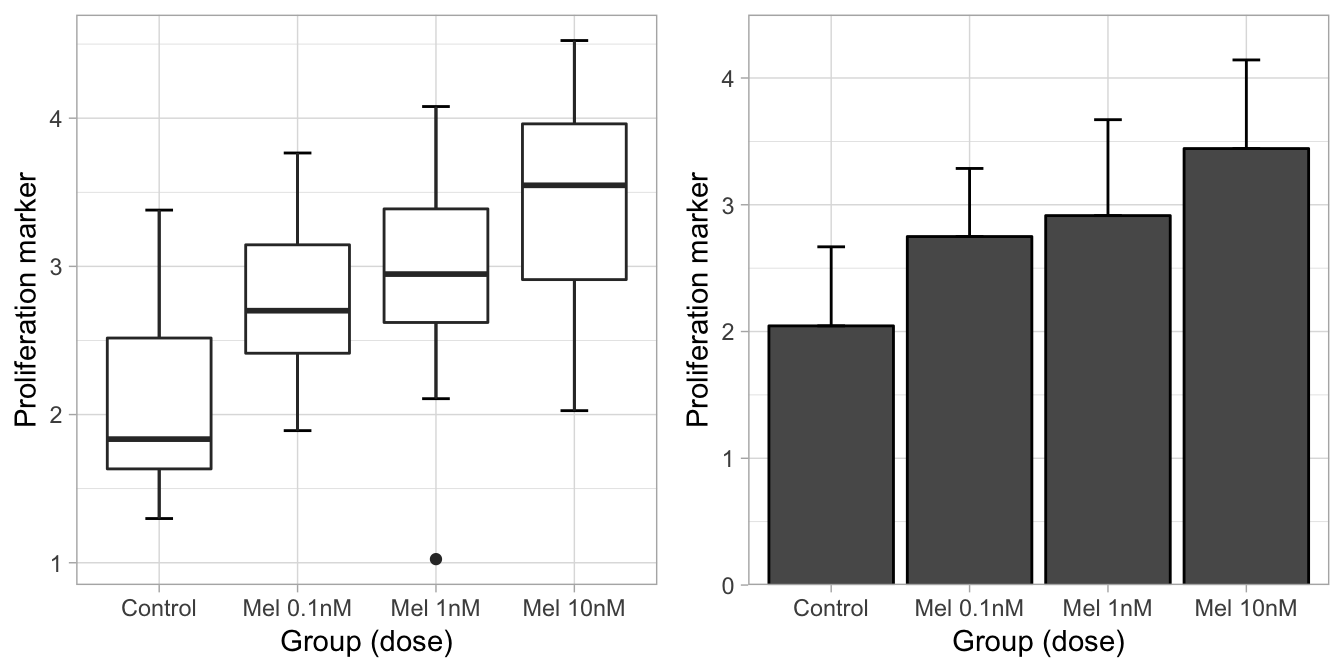
## $ Proliferation: num 1.61 2.82 2.79 3.38 1.87 ...Ok, we have a proliferation vector measured as fluorescence of some surface protein marker, separated into 4 groups: Control, Melatonin 0.1 nM, Melatonin 1 nM, and Melatonin 10 nM.
Plot
Let’s plot!
Make a Box plot:
boxplot <- ggplot(df,aes(x=Group,
                         y=Proliferation)
                  )+
  stat_boxplot(geom='errorbar',width=.2)+
  geom_boxplot()+
  scale_x_discrete(name='Group (dose)')+
  scale_y_continuous(name='Proliferation marker')+
  theme_light()
Make a bar plot, with mean and standard deviation bars:
# Summarize (needed for the barplot)
bars <- df %>%
  group_by(Group) %>%
  summarize(proliferation=mean(Proliferation),
            sd=sd(Proliferation)
            )
# Plot
barplot <- ggplot(bars,aes(x=Group,
                           y=proliferation)
                  )+
  stat_summary(fun.y='mean',geom='bar',color='black')+
  geom_errorbar(width=.2,aes(ymin=proliferation,
                    ymax=proliferation+sd))+
  scale_x_discrete(name='Group (dose)')+
  scale_y_continuous(name='Proliferation marker',
                     expand=c(0,0),limits=c(0,4.5)
                     )+
  theme_light()
Print layout:
ggdraw()+
  draw_plot(boxplot,0,0,.5,1)+
  draw_plot(barplot,.5,0,.5,1)